-
Best Forex Brokers
Our top-rated Forex brokers
-
No-deposit Bonuses
Live trading with no deposit
-
Brokers for Beginners
Start trading here
-
Forex Demo Accounts
Learn to trade with no risk
-
Lowest Spread Brokers
Raw spreads & low commissions
-
TZS Trading Accounts
Save on conversion fees
-
Islamic Account Brokers
Best accounts for Muslim traders
-
ECN Brokers
Trade with Direct Market Access
-
Market Maker Brokers
Fixed spreads & instant execution
-
All Trading Platforms
Find a platform that works for you
-
MetaTrader 4 Brokers
Top MT4 brokers in Tanzania
-
MetaTrader 5 Brokers
Top MT5 brokers in Tanzania
-
cTrader Brokers
Top cTrader brokers in SA
-
Best TradingView Brokers
The Top TradingView Brokers
-
Copytrading Brokers
Copy professional traders
-
Forex Trading Apps
Trade on the go from your phone


Last Updated On Oct 16, 2023

On Saturday, 7th October, Hamas launched a massive attack into southern Israel from its stronghold in the Gaza strip. Unusually, the Israeli government was caught completely by surprise – Israel’s intelligence agencies are infamous for infiltrating Palestinian militant networks and snuffing out potential threats long before they become reality.
Because Israel was caught by surprise, so was the world – and consequentially the global financial markets. The market reaction so far has been exactly as any fundamental analyst would expect, though with some interesting variations.
US dollar (USD)
The USD, as represented by the DXY index, received an immediate boost in the aftermath of the attack as traders moved to haven assets. However, once the shock of the attack wore off, the USD has fallen against most major currencies, as has the DXY. Traders believe that, until proven otherwise, the war will remain localised and more traditional fundamental factors – such as the ongoing inflation/interest rate conundrum – are more important.
Gold
Every time a major war breaks out, gold prices rise, and this time was no exception. Since October 8th, the XAU/USD has soared to over 1880 and shows no signs of slowing. While the war in Israel was the catalyst for this bullish move, other factors are at play here. Gold has suffered a torrid few months in the face of a strong US dollar, falling from a peak of over 2050 in May to lows of 1815 earlier this month. The recent weakness in the USD has turbocharged the correction instigated by the war in Israel. We may see a sustained bull run in gold prices, though much will depend on the Fed’s interest rate decision at the end of the month.
Crude oil
Crude oil prices have been on a rollercoaster recently. After steadily rising all summer, prices spiked after Saudi Arabia and Russia announced a continuation in cuts to supply. But since the end of September, prices have collapsed as concerns of a sustained fall in global growth hit energy prospects. This paradigm was turned on its head by Hamas’ attack on Israel. Israel is not a major oil producer, but the prospect of the war becoming an international conflict – with Iran being eyed nervously – spooked traders enough to push WTI Crude up over the psychological $85 level. Much like the USD, though, prices have since fallen as the threat of the conflict boiling over into a wider international war has faded.
Israeli shekel (ILS)
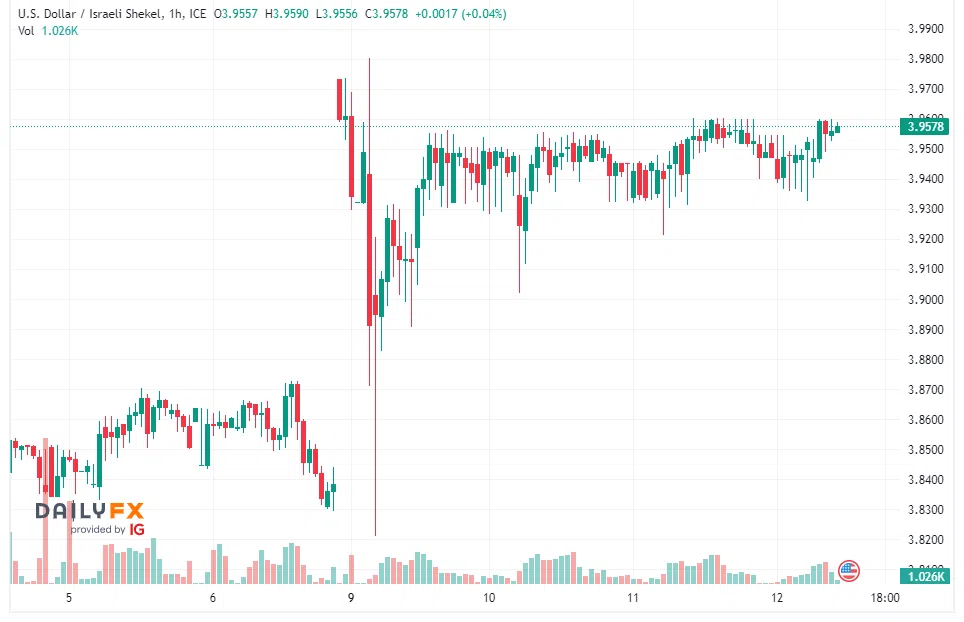
Not a commonly traded currency pair, the USD/ILS has nevertheless had an interesting week, as you can see from the chart above. Expecting a run on the ILS following Hamas’ attack, the Bank of Israel made a pre-market announcement on Monday that it would be selling 45 billion USD in forex reserves to support the shekel. This move hasn’t been a complete failure, but the USD/ILS is trading at its highest levels since 2016 after the shekel fell 2.7% against the greenback. The ILS has since stabilised, and markets are wary of any attempts to short the currency. Murat Toprak, a strategist at HSBC Holdings, said, “An equivalent selling of US dollars should not have any meaningful impact on Israel’s solvency metrics. Israeli authorities have solid experience of intervention in the FX market.” It’s also worth noting that the ILS has already lost 10% against the USD this year, as social unrest linked to controversial judicial reforms has alarmed traders and investors.
Business as usual, but remain wary.
So, while the attack surprised markets and led to an immediate shift in fundamentals, traders have since relaxed as the threat of a wider international conflict has faded. Overall, more traditional fundamental and technical price movement has since been restored, with markets looking to inflation figures, bond yields and interest rates. Traders should be wary, though; the main actors in this conflict’s long and bloody history are not known for their restraint, and all wars are unpredictable by their nature.
On the Technical Front
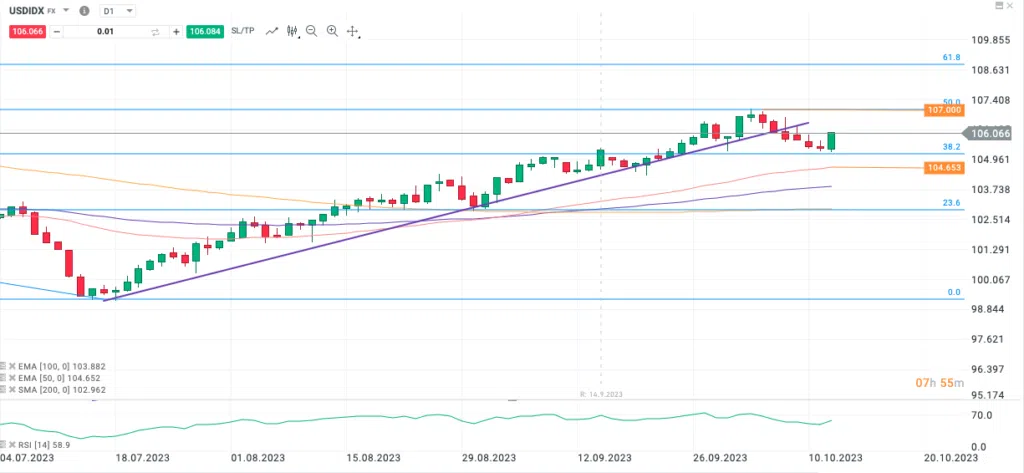
The Dollar Index
Having lost 1.6% of its value in October, the greenback appears to have ended its summer rally that began in mid-July 2023. The dollar opened lower than 106.00 for the third day in a row, heading towards the 38.2% Fibonacci levels, likely fuelled by the belief that the Fed will pause further rate hikes.
Today’s tick-up in inflation boosted the index, and the technical analysis shows that upward momentum is still possible, particularly since it has broken through the psychologically important 106.00 handle. Its next target could be the 50% Fibonacci retracement level at 107.00. Further downsides could see the index bounce off the 50-day EMA (pink) support level at 104.627.
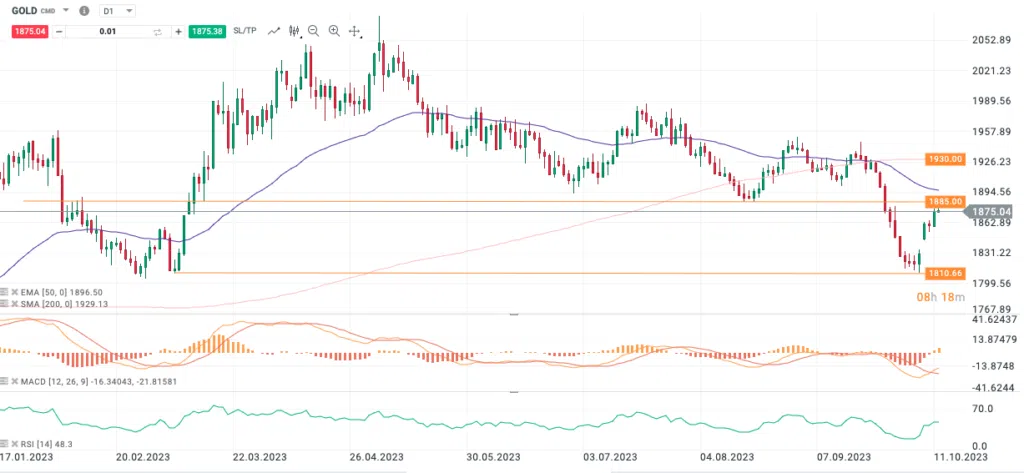
Gold
Having hit its lowest level since February 2023, at 1810 $/oz, gold has rebounded more than 2.4% this week. A reliable safe haven during times of conflict, the surge in gold also coincided with cooling inflation in the US and a sell-off of the greenback. The geopolitical tensions in the Middle East prevented the precious metal from testing support at the $1800/oz level, causing huge upward momentum, and allowing it to recover 30% of the losses from September. This makes it the best 5-day performance since March 2023.
The next major resistance gold faces will be the $1885/oz level, and although the fundamentals seem to support the bulls, the technical indicators tell a different story. Still riding below the moving averages, the price will have to surpass the 200-day SMA $1930/oz region to confirm an upward bias.